The Lord’s Prayer
Our Father, who art in heaven, hallowed be thy name. Thy Kingdom come, Thy Will be done, on earth as it is in heaven. Give us this day our daily bread and forgive us our trespasses, as we forgive those who trespass against us. And lead us not into temptation, but deliver us from evil. Amen
3:26 pm
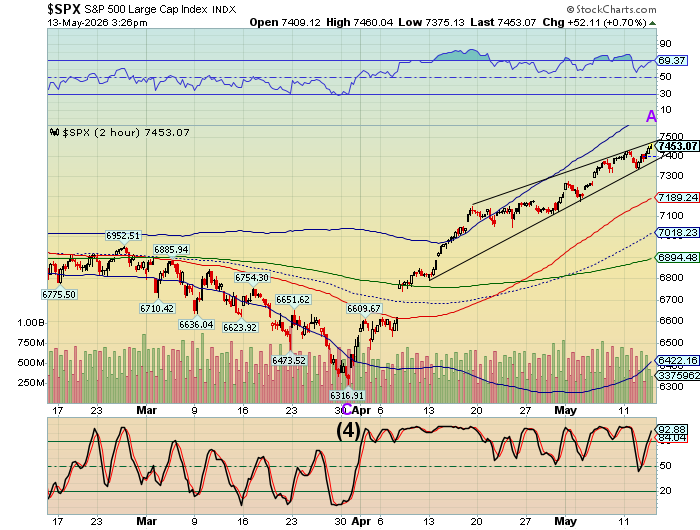
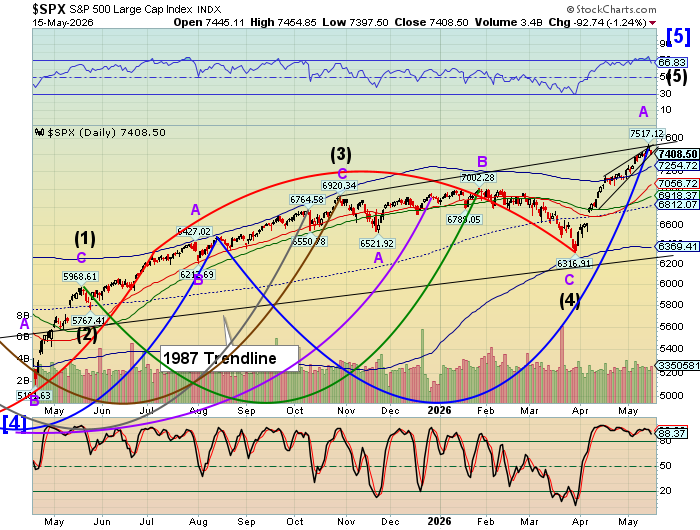
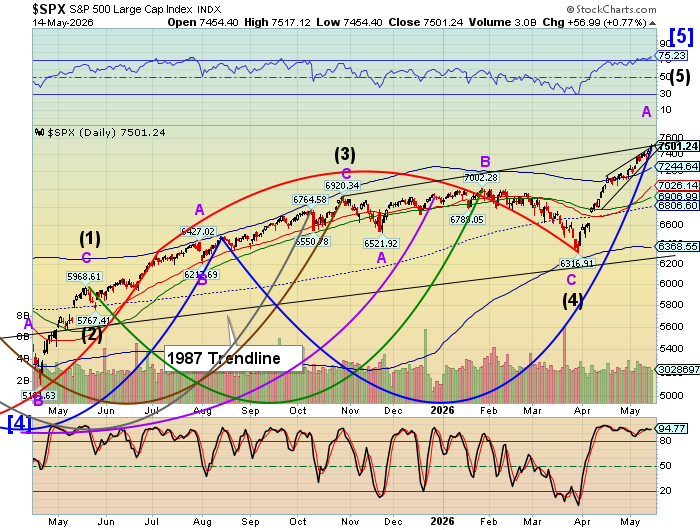
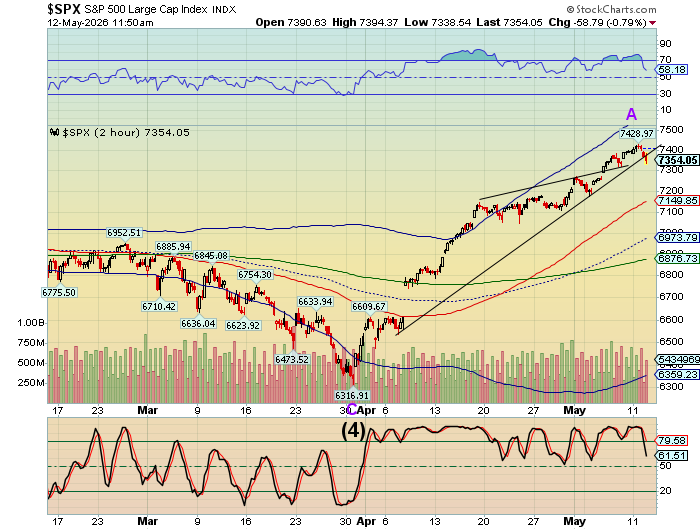
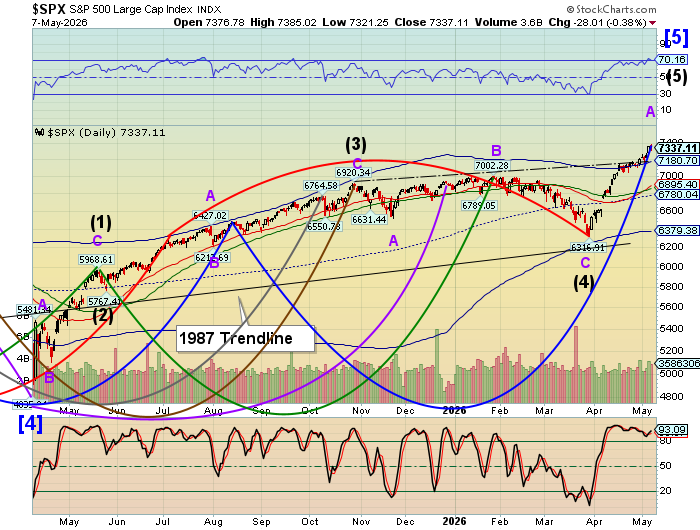
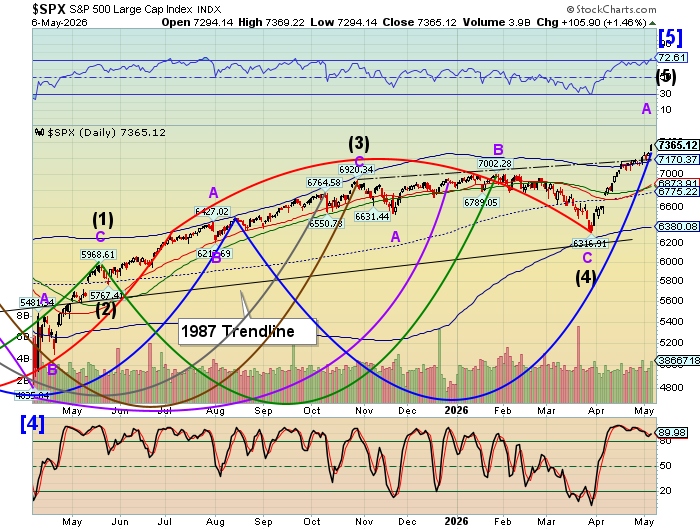
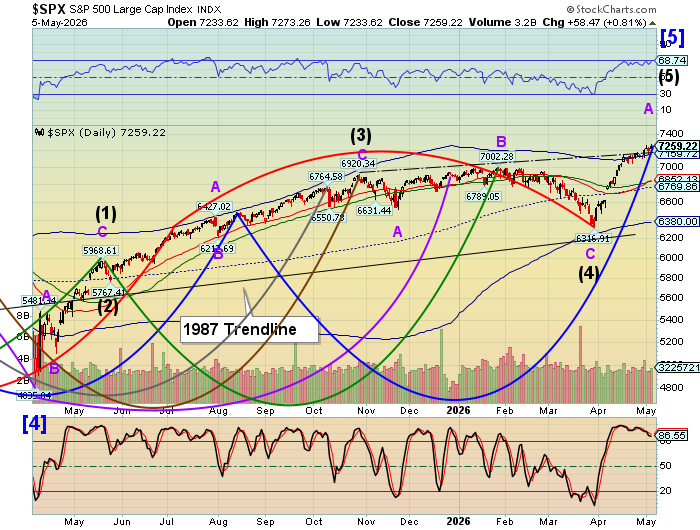
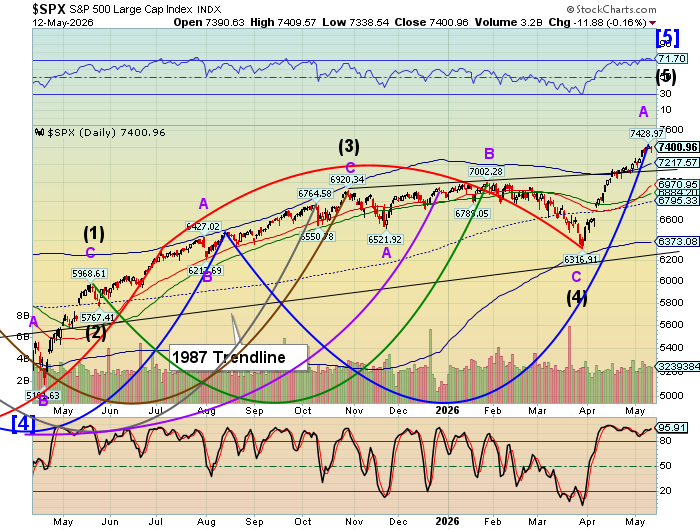
The SPX top of the Master Cycle has been evasive. However, trendlines were more accurately drawn and the upper Ending Diagonal trendline appears to offer resistance at 7475.00. The final probe may be complete or nearly so. Meanwhile investors and managers have continued buying the dip.
8:00 am
Good Morning!
SPX futures reached a new high at 7430.50 this morning before easing back. A marginal new high is possible, as the normal Master Cycle has the capability to extend to the end of the week in overtime. However, yesterday’s tremor, which fell short of a sell signal, may be a warning of larger moves ahead. The most comfortable place to be may be on the sidelines.
Today’s options chain shows Max Pain at 7385.00. Long gamma begins above 7400.00 while short gamma strengthens beneath 7330.00.
ZeroHedge reports, “US equity futures are up (alongside oil and yields, go figure), reversing yesterday’s modest losses, as optimism around the earnings potential of AI outweighs concerns over hot inflation readings bringing dip buyers back to drive tech stocks higher, with traders betting that the tech rally has further room to run while also hoping on good news from the Trump-Xi summit set to start today in Beijing.”
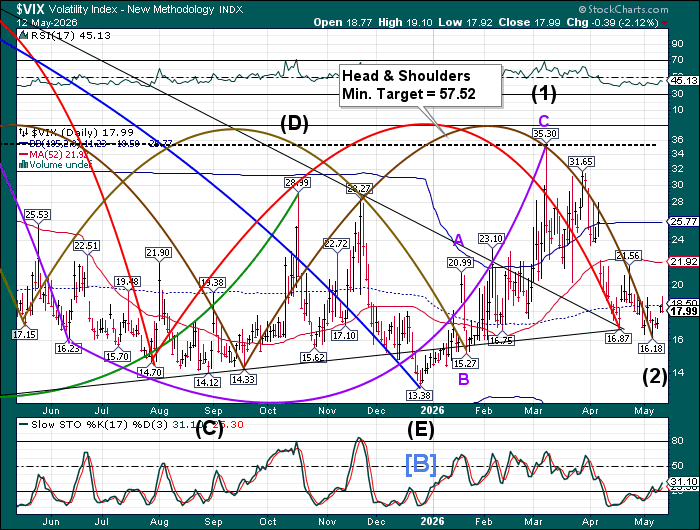
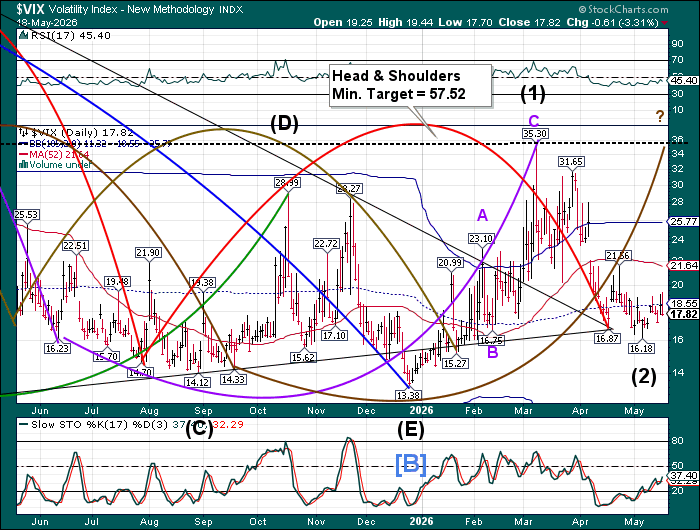
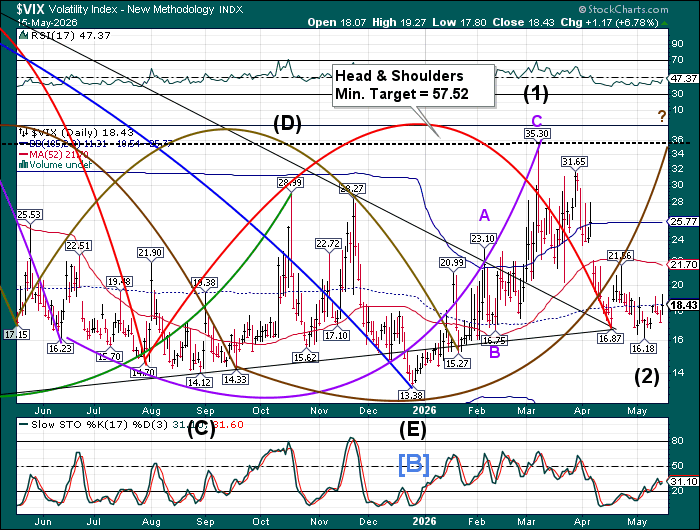
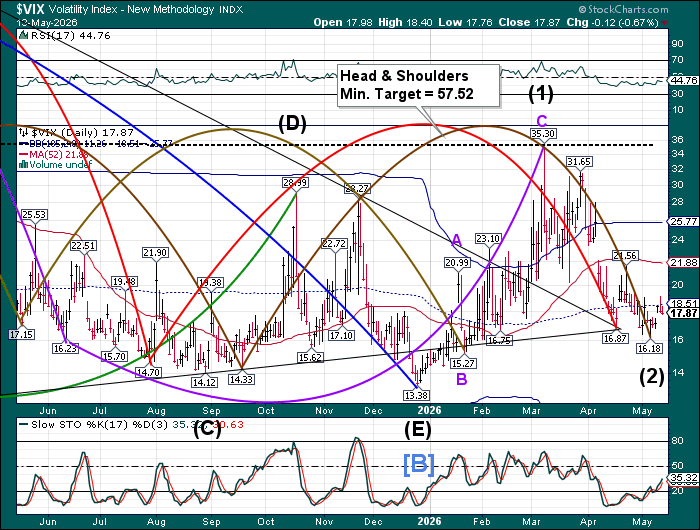
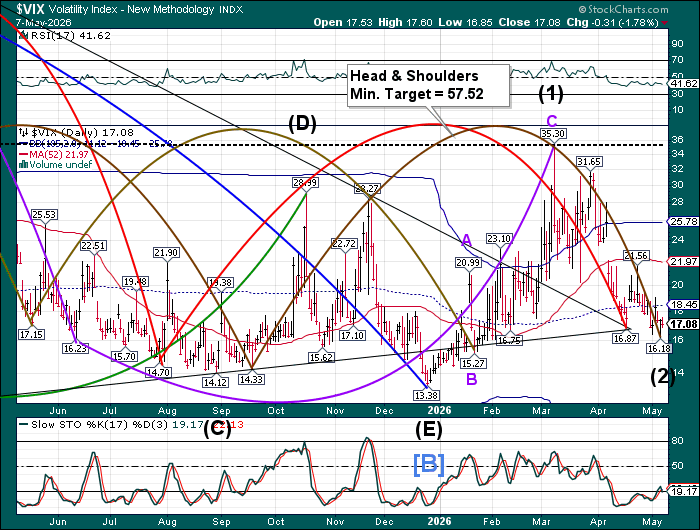
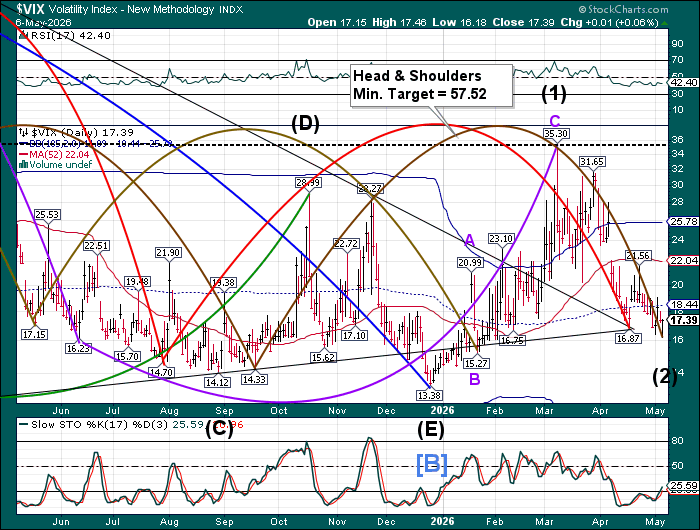
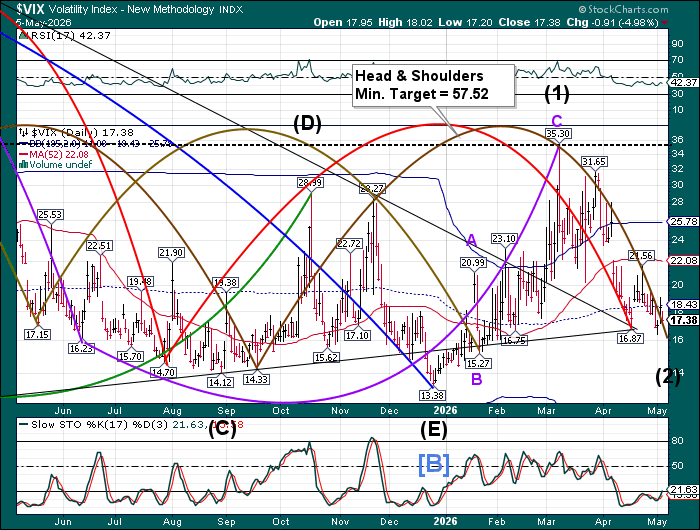
The premarket VIX probed lower, to 17.82 this morning, testing a short term support at 17.80. It may go lower, but a new low beneath 16.18 may not be probable.
Today is options expiration for the VIX, so we turn our attention to the May 19 (monthly) expiration. The options chain shows Max Pain at 22.00. Short gamma resides beneath 21.00 while long gamma strengthens above 23.00.
ZeroHedge comments, “One macro strategist is now making, in far more measured institutional language, the same argument I made days ago: this is not a normal bull market.”

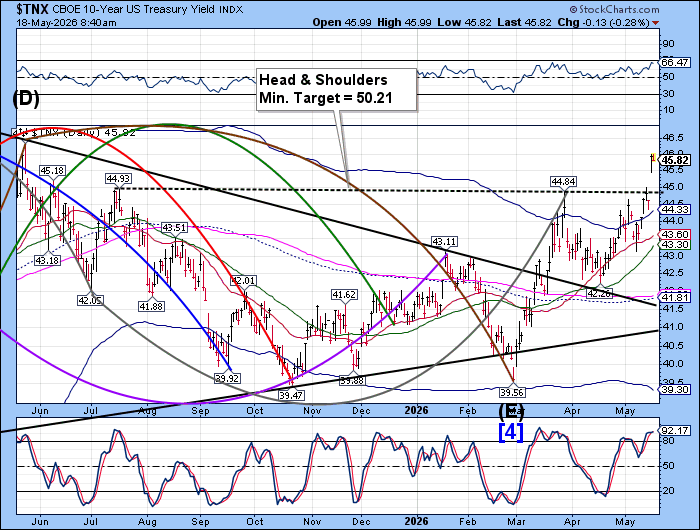
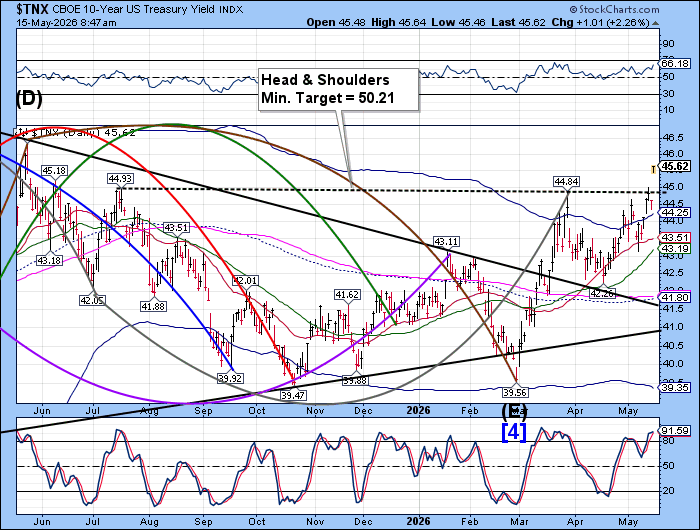
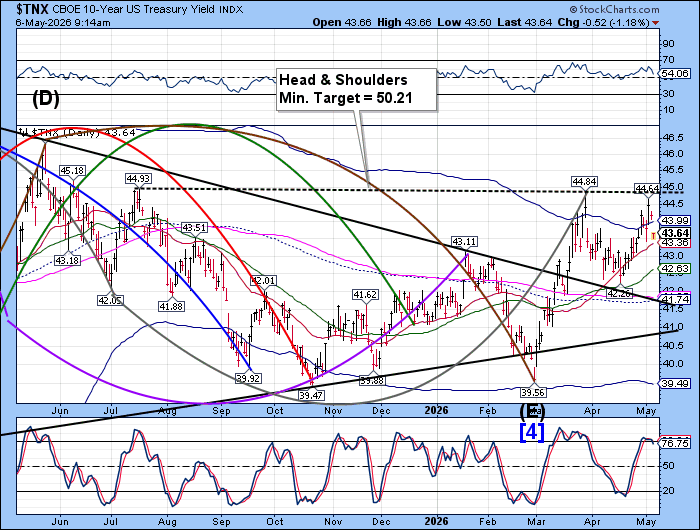
The US 10-Year Bond Yield may have challenged the neckline of the Head & Shoulders formation at 44.84 this morning, with implications that it may go higher. Should it close above the neckline, the formation may be activated. The current Master Cycle stretches to early June, giving TNX enough time to make a significant attempt at the potential target.
ZeroHedge observes, “With 30Y yields trading on the wrong side of 5% today, all eyes were on today’s 10Y refunding auction to see if it would be ugly enough to push yields to 4.50% or higher. Here is what happened.”
This morning, ZeroHedge reports, “After yesterday’s hotter than expected CPI (driven in large part by Energy, but seeing some contagion into Services costs), this morning’s Producer Price print for April was expected to show a major surge in annual wholesale inflation.
With the eight straight monthly increase, PPI rose by a massive 1.4% MoM (vs +0.5% MoM exp) – the biggest MoM jump since March 2022, lifting PPI by a stunning 6.0% YoY (vs 4.8% YoY exp). That is the hottest PPI YoY since Dec 2022…”

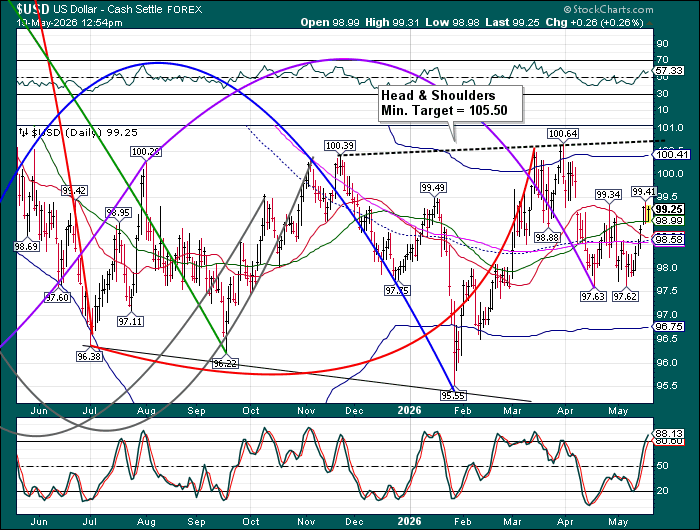
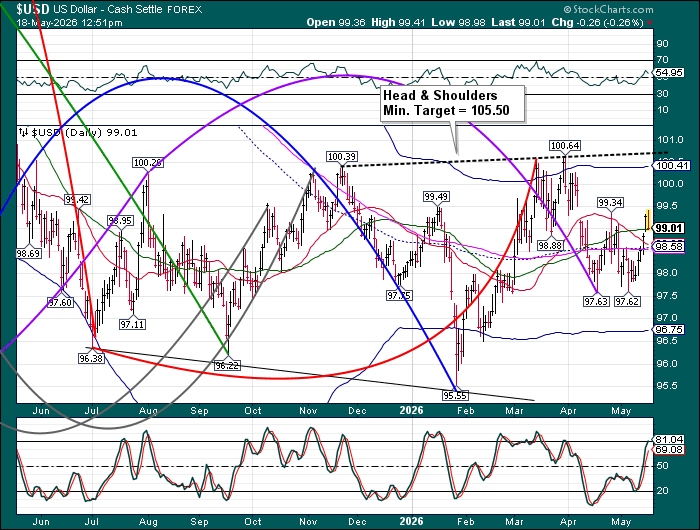
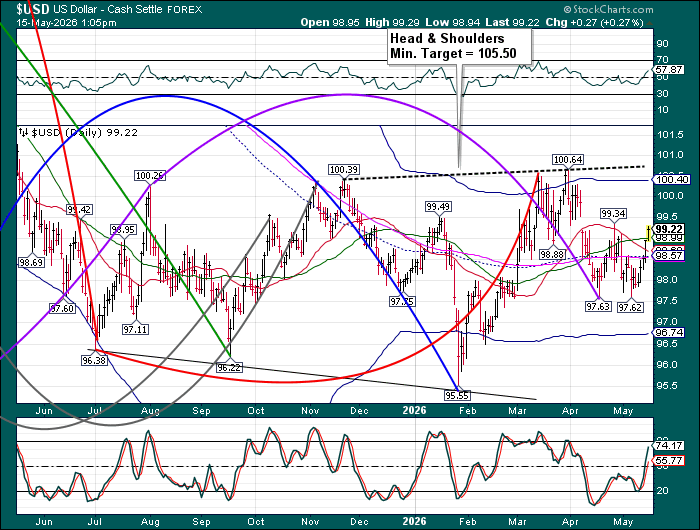
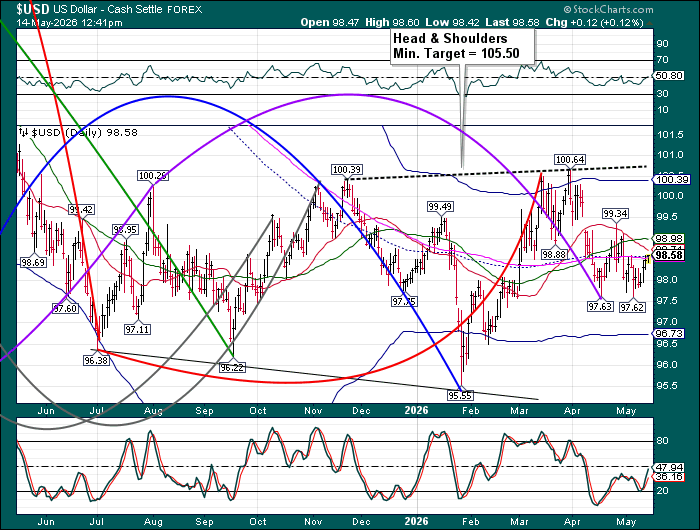
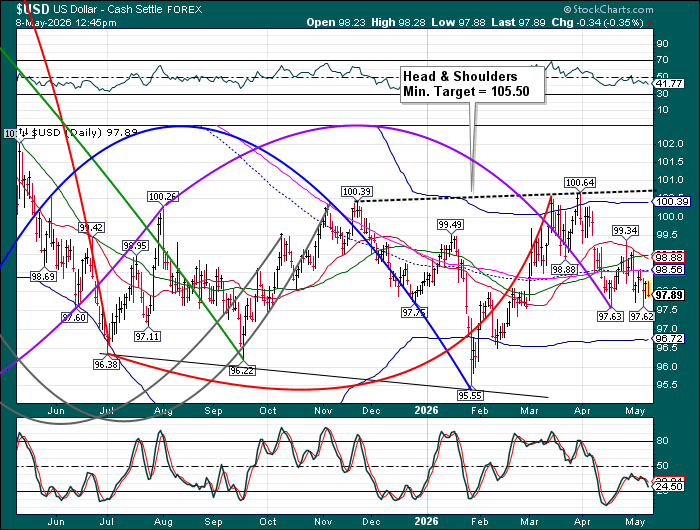
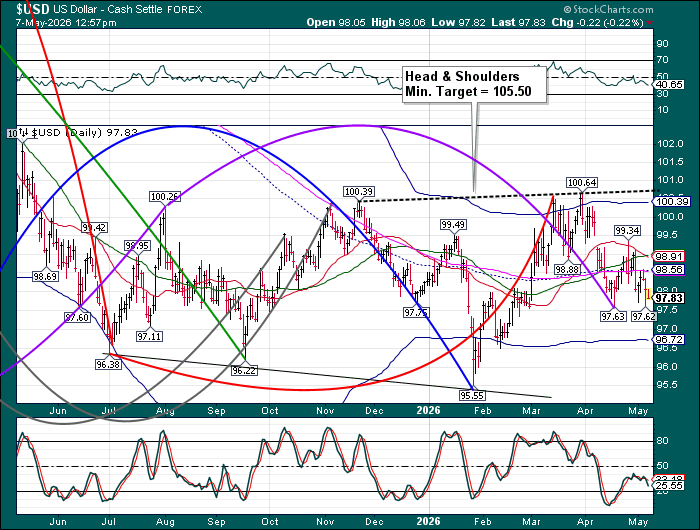
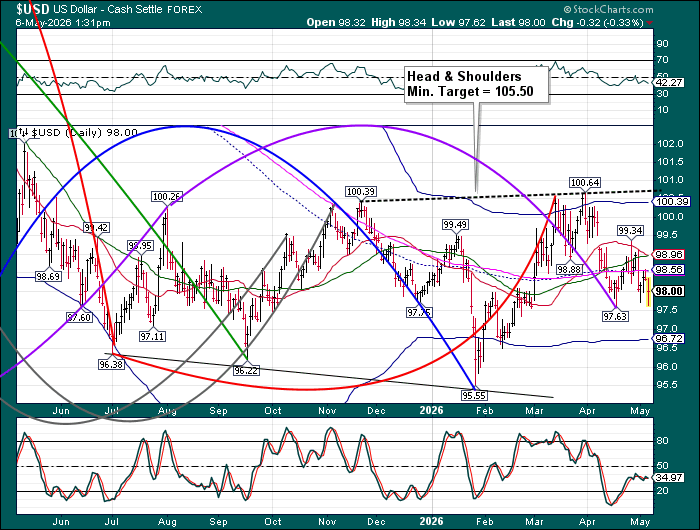
The US dollar is challenging mid-Cycle resistance at 9856. Should it close above it, a buy signal may be obtained. This may escape the attention of the dollar bears until it rises above the 522-day Moving Average at 98.99. There are a lot of vocal dollar bears who do not recognize how valuable the USD may be in these times.

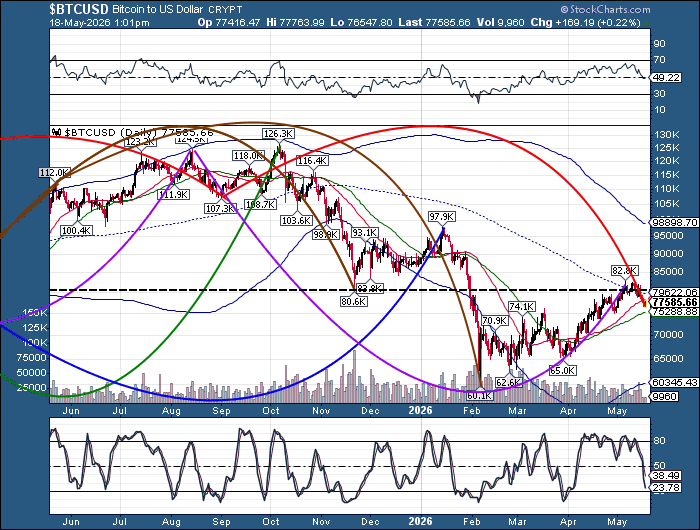
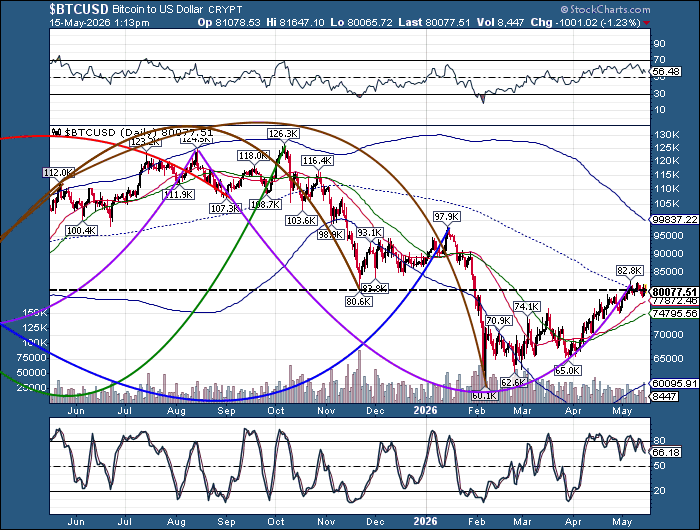
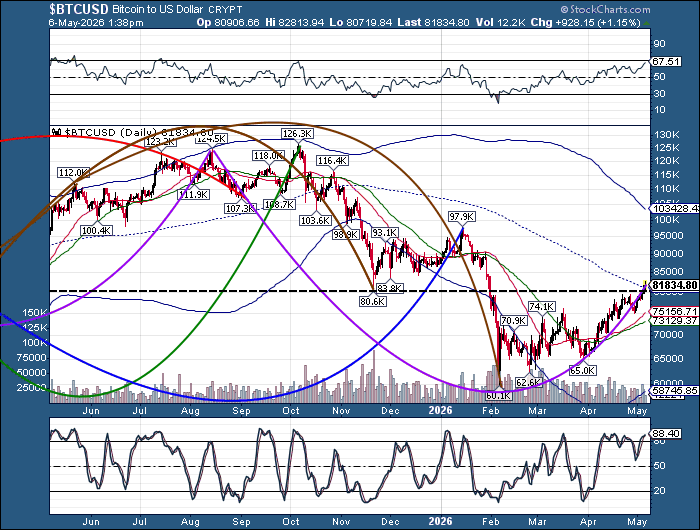
Bitcoin is straddling its two support/resistance lines, remaining just beneath the trendline at 80600.00. It is due for a decline over the next couple of weeks with a possible target near the 52-day Moving Average at 74433.00. It could go lower, but lacks a potential target.

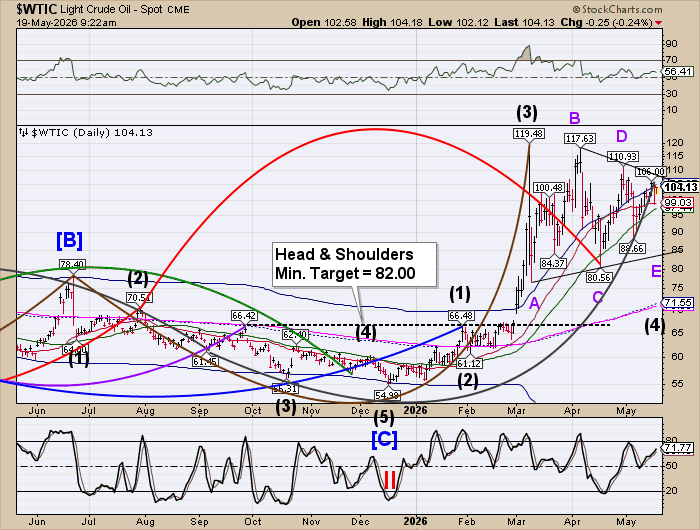
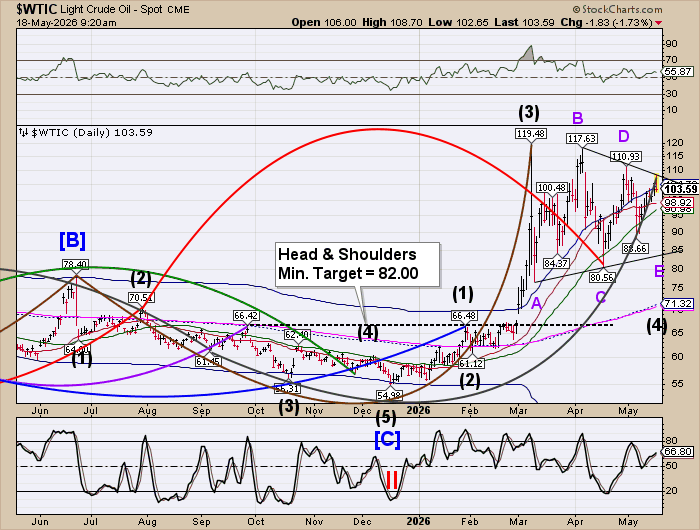
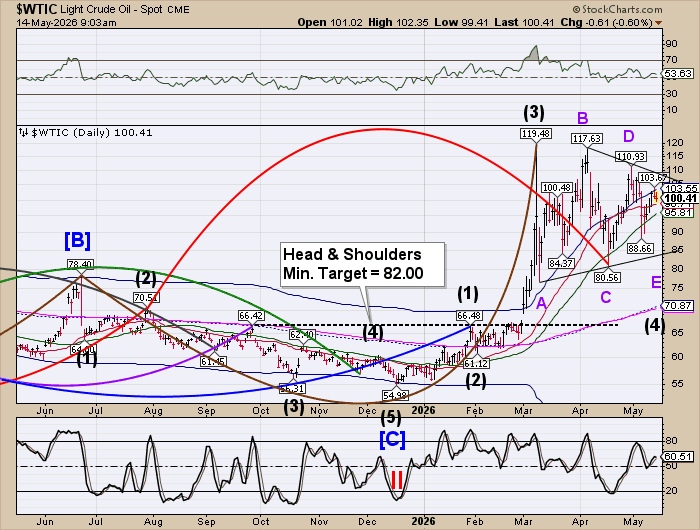
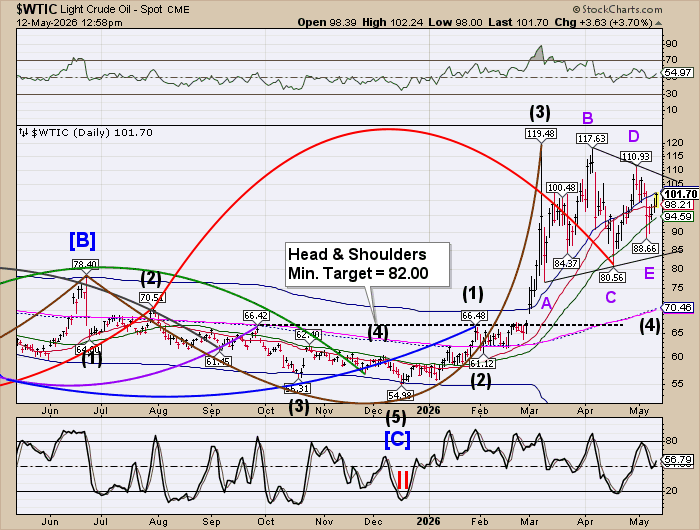
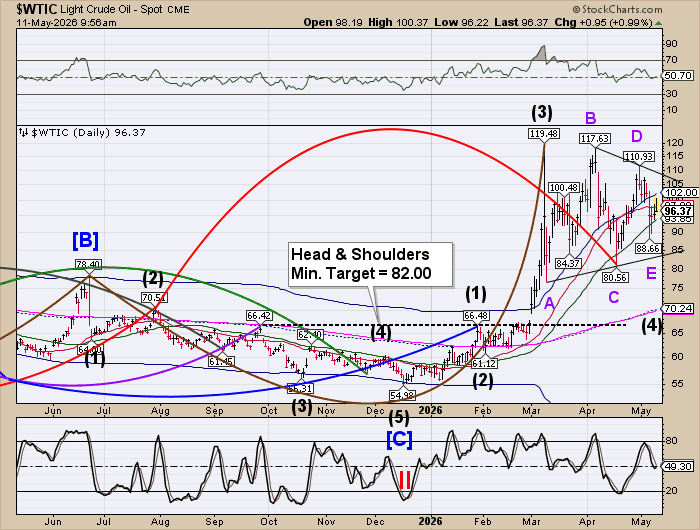
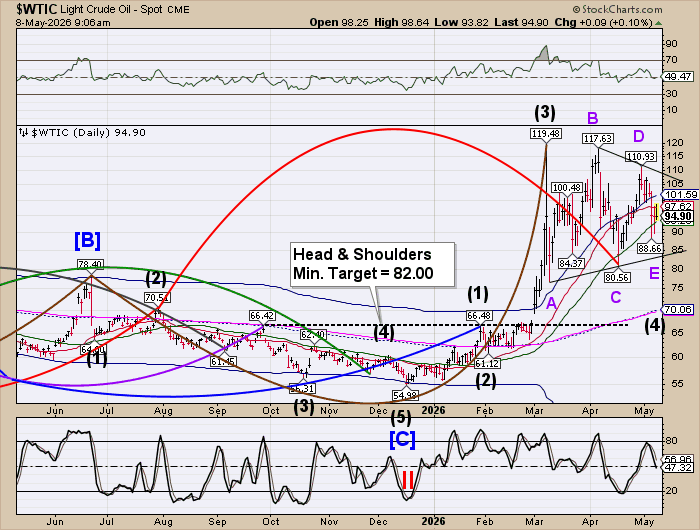
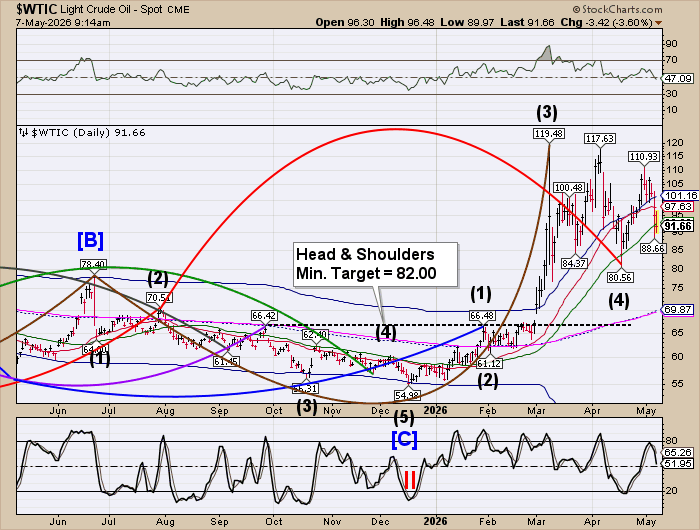
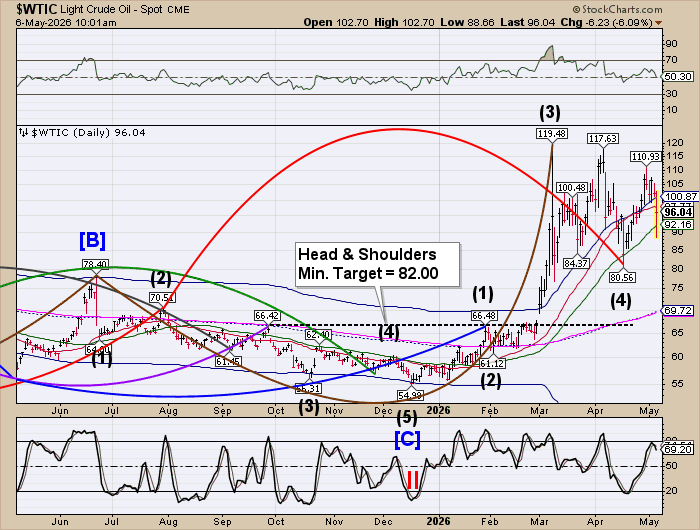
Crude oil rose to its cycle Top resistance at 103.11 , but did not cross it, leaving open the possibility of a pullback to the lower Triangle trendline to complete the formation. Wave E’s are know to be rogues, so the price of crude may drop beneath the trendline in the next week or so. Most investors are looking for higher prices, which may be a disappointment.
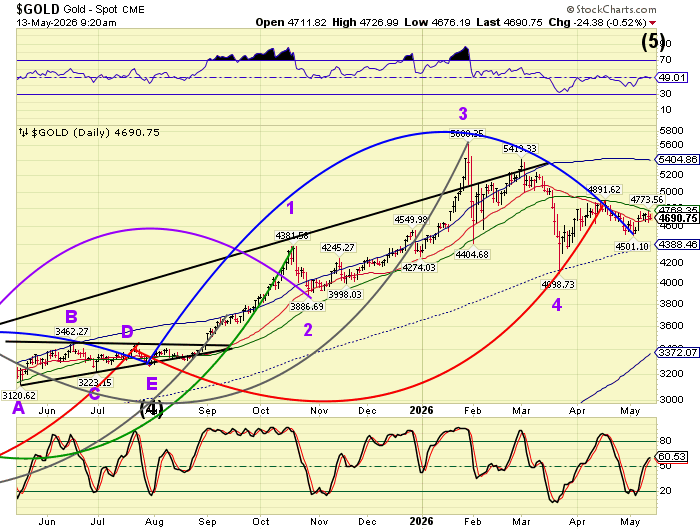
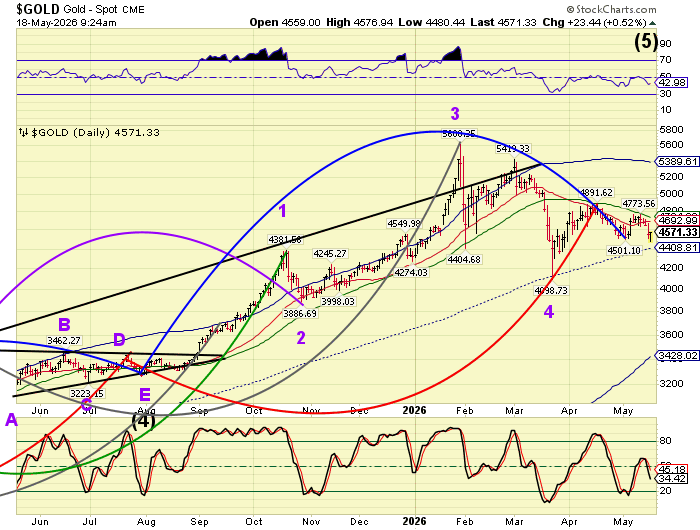
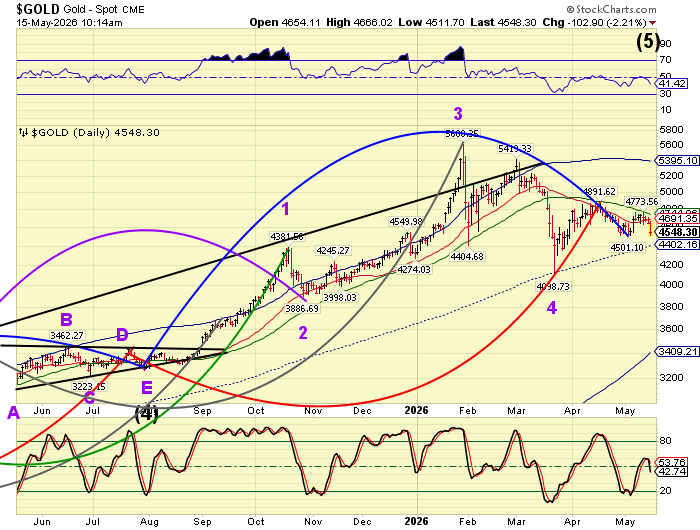
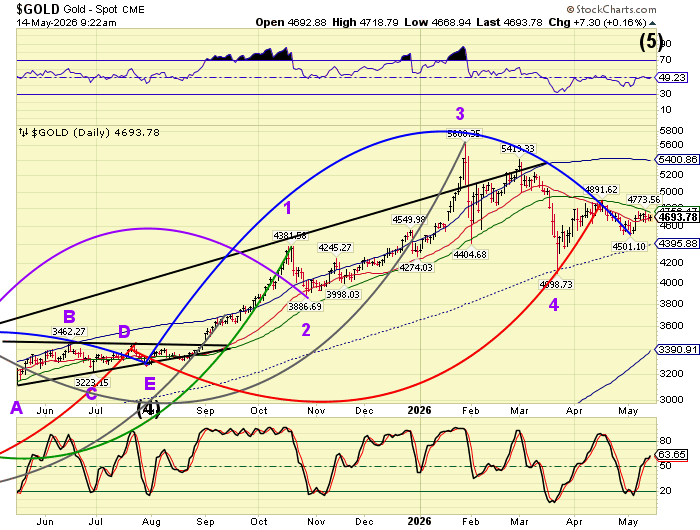
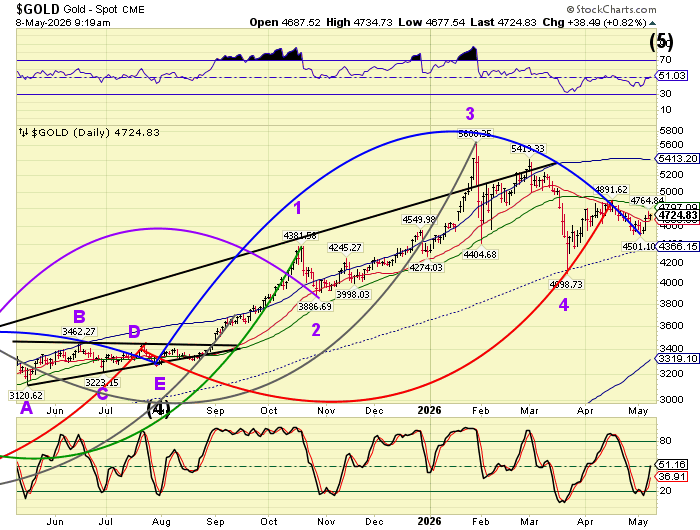
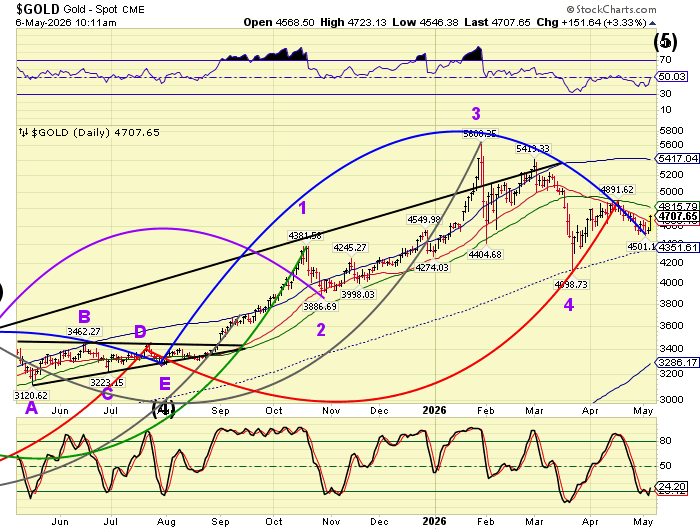
Gold has been consolidating between Intermediate support and the 52-day resistance for the past week. It may be due for a decline to the mid-Cycle support at 4388.46 by the end of the month per the Cycles Model.